

Map Legends
Data plotted onto maps using shapes is colored to differentiate between the values of each representative region plotted. These colors are generated by 2 different algorithms - one based on continuous values and the other based on discrete values. Users change the type of legend used on a map to set the appropriate algorithm. The different types are effected through the "Legend Type" drop down menu on the map ribbon tab.
Legend Types
There are effectively 2 types of legends:
- Continuous - which presents legends in either a vertical or horizontal format, with shapes colored based on their relative value position between the maximum, minimum and median values for the relevant dataset.
- Discrete - which presents legends in a vertical format, broken out into discrete range bands. Shapes are colored based on which band their values falls into.
- Discrete bands can be set 2 bands up to 10 bands.
- Different highlight types from the "Map Highlight" drop down menu include predefined discrete band counts. These can be overridden by setting the discrete band count from the Legend Type drop down menu.
Examples of the different algorithms, legends and their effect on the map visualization are below:
| Type | Map |
|---|---|
| Continuous Horizontal |
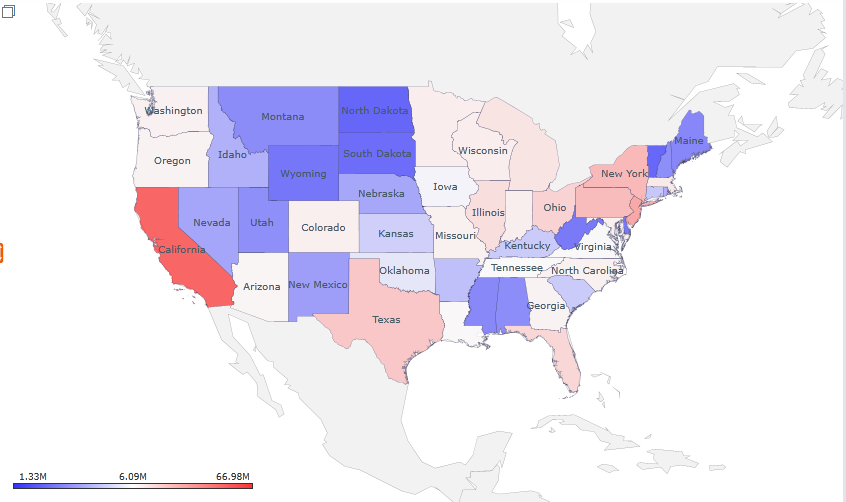
|
| Continuous Vertical |
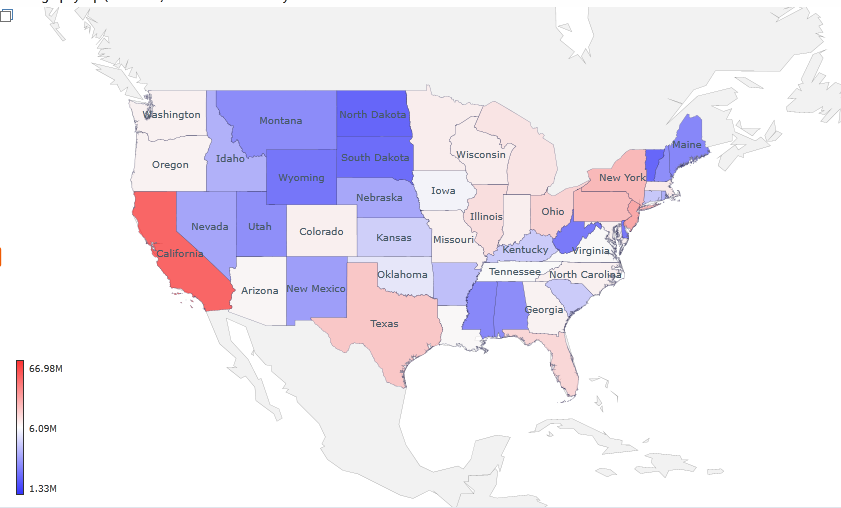
|
|
Discrete (10 or 'deca' band) |
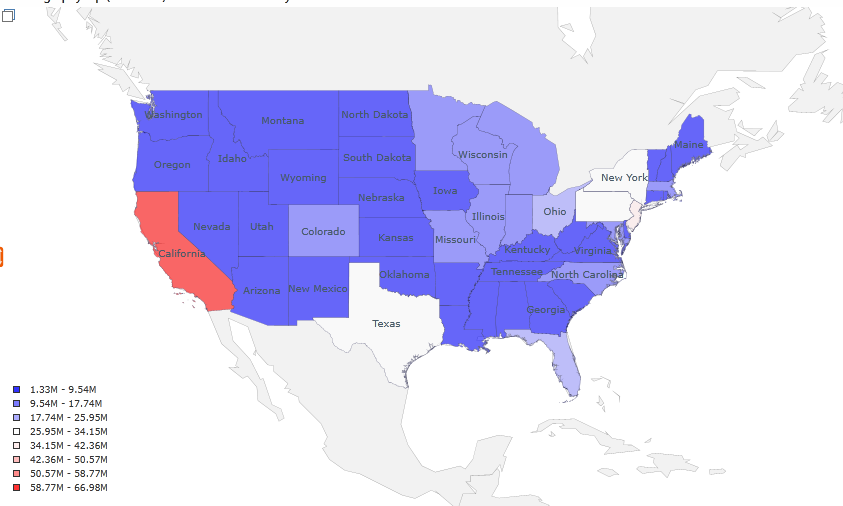
|
Home |
Table of Contents |
Index |
User Community
Pyramid Analytics © 2011-2022